

Every Pix4D and Metashape quality report ships numbers that look official. Green checkmarks, sub-pixel reprojection errors, centimeter-level Ground Control Point (GCP) residuals. Operators scan, see no obvious red flags, and send the data. Then the contractor shows up with a total station and finds 8-inch elevation errors on what was supposed to be survey-grade.
The report wasn’t lying. The operator just didn’t know which numbers to trust.
I’ve delivered enough quality reports to know exactly which fields will get challenged in a deposition and which ones reviewers ignore. This guide walks through both Pix4D and Metashape section by section: what each number measures, what the thresholds are, and where the numbers will quietly mislead you. For the conceptual background on Root Mean Square Error (RMSE) and why checkpoints exist, see Understanding RMSE in Drone Mapping.
The Two Types of Numbers in Every Report
Before reading a single table, get the categories straight. Quality reports contain two fundamentally different kinds of metric.
Internal consistency metrics — reprojection error, camera optimization percentage, keypoint match counts — measure how well the model fits itself. A reprojection error of 0.3 pixels means the software’s 3D model is internally coherent. It says nothing about whether that self-consistent model is sitting in the right place on Earth.
External accuracy metrics — checkpoint errors — measure how well the model matches reality. These are the only numbers that validate accuracy for delivery. Everything else is a health indicator.
Most operators read the internal numbers and call it done. That’s where bad deliverables come from.
Reading the Pix4D Quality Report
Calibrated Images and the Dataset Summary
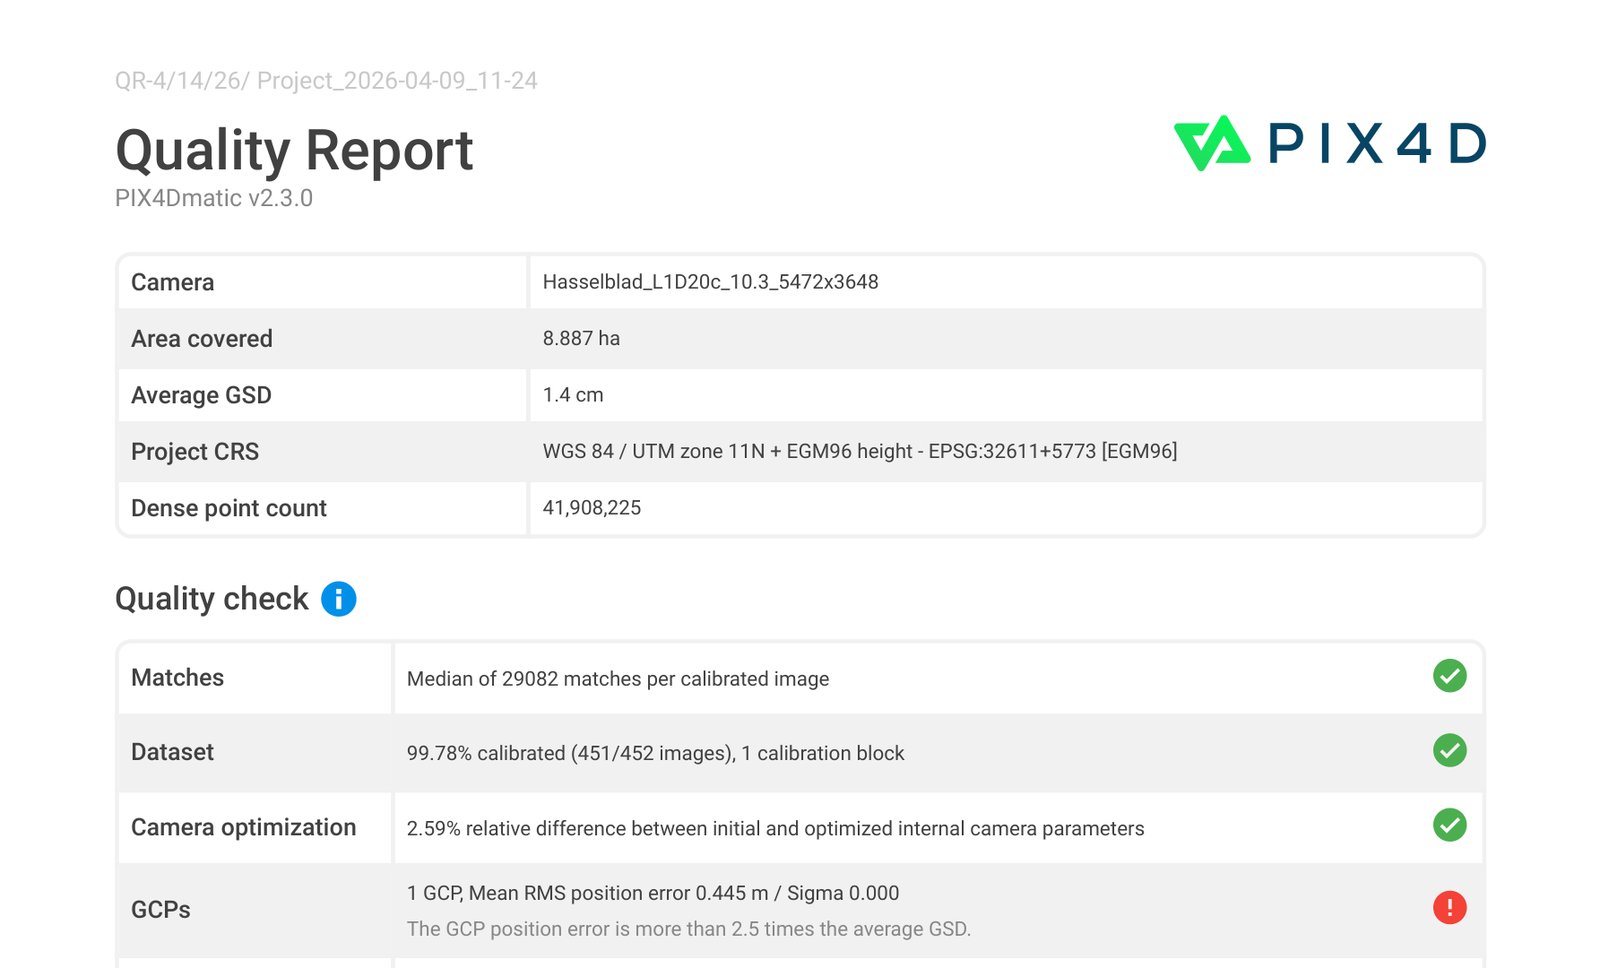
The number that matters first is calibrated image percentage.
| Status | Threshold | What it means |
|---|---|---|
| Green | >95% calibrated | Acceptable — proceed |
| Orange | 75–95% calibrated | Investigate — what areas failed? |
| Red | <75% calibrated | Do not deliver |
If more than 5% of images failed calibration, those areas have no photogrammetric support. The orthomosaic will render — Pix4D will interpolate or fill — but the geometry underneath is unreliable.
Ground Sample Distance (GSD) is your scaling reference for everything else. If your median GSD is 2.5 cm/px:
- Horizontal checkpoint RMSE: 1–2× GSD (2.5–5 cm)
- Vertical checkpoint RMSE: 2–3× GSD (5–7.5 cm)
- GCP RMS: under 1.5× GSD (PIX4Dmatic green); over 2.5× GSD = red
Camera Optimization: The Most Misread Section
The table compares your camera’s initial internal parameters against the optimized values that bundle adjustment converged on. The “Relative Difference” column shows percentage change.
Thresholds:
- <5% difference: Green per Pix4D.
- 5–20% difference: Yellow — investigate.
- >20% difference: Red — significant error per Pix4D.
Practitioner heuristic on flat featureless terrain: even values in the 3–5% range can correlate with doming — run a DSM profile if you see anything above ~3%.

What does a >5% K1 shift actually mean? The software re-estimated your lens’s radial distortion coefficient substantially during bundle adjustment. As a practitioner heuristic, K1 shifts above ~10% suggest the software is substantially re-learning your lens — even though Pix4D’s percentage check formally applies to focal length (or affine C/F for fisheye), not directly to K1. When camera optimization comes back red, run a terrain profile across a flat area in the Digital Surface Model (DSM). A dome or bowl on terrain you know is flat means calibration failed to constrain the distortion — see The Doming Effect in Drone Maps for the full diagnostic walkthrough.
2D Keypoints: What the Match Map Tells You
Key thresholds:
- Median keypoints per image (default image scale): under 500 is red — the image lacks texture or is blurry. 500–10,000 is yellow. Over 10,000 is green. (Pix4D uses lower thresholds — 200/1,000 — when image scale is set to ≤1/4, but that’s an unusual configuration.)
- Minimum matches to calibrate an image: 25 matches. Below this, Pix4D cannot include the image in the reconstruction.
The 2D Keypoint Match Map visual is more useful than the table. It shows lines connecting matched image pairs. A dense black network means strong geometry. White areas, sparse connections, or isolated images in the interior of your flight are problems. Perimeter sparseness is expected; interior gaps are not.
GCP Errors vs. Checkpoint Errors
GCP errors show how well the final model fits the points you fed the software. Those points anchored the model. A GCP RMS of 1 cm proves the bundle adjustment honored those five locations. It proves nothing about the other 500,000 locations on the map.
Checkpoint errors are categorically different. The software never saw these coordinates. A checkpoint RMS of 3 cm on a 2 cm GSD project is honest, validated accuracy. A GCP RMS of 3 cm by itself means nothing.
For a deeper treatment of this distinction, see Checkpoints vs. Control Points in Drone Survey.
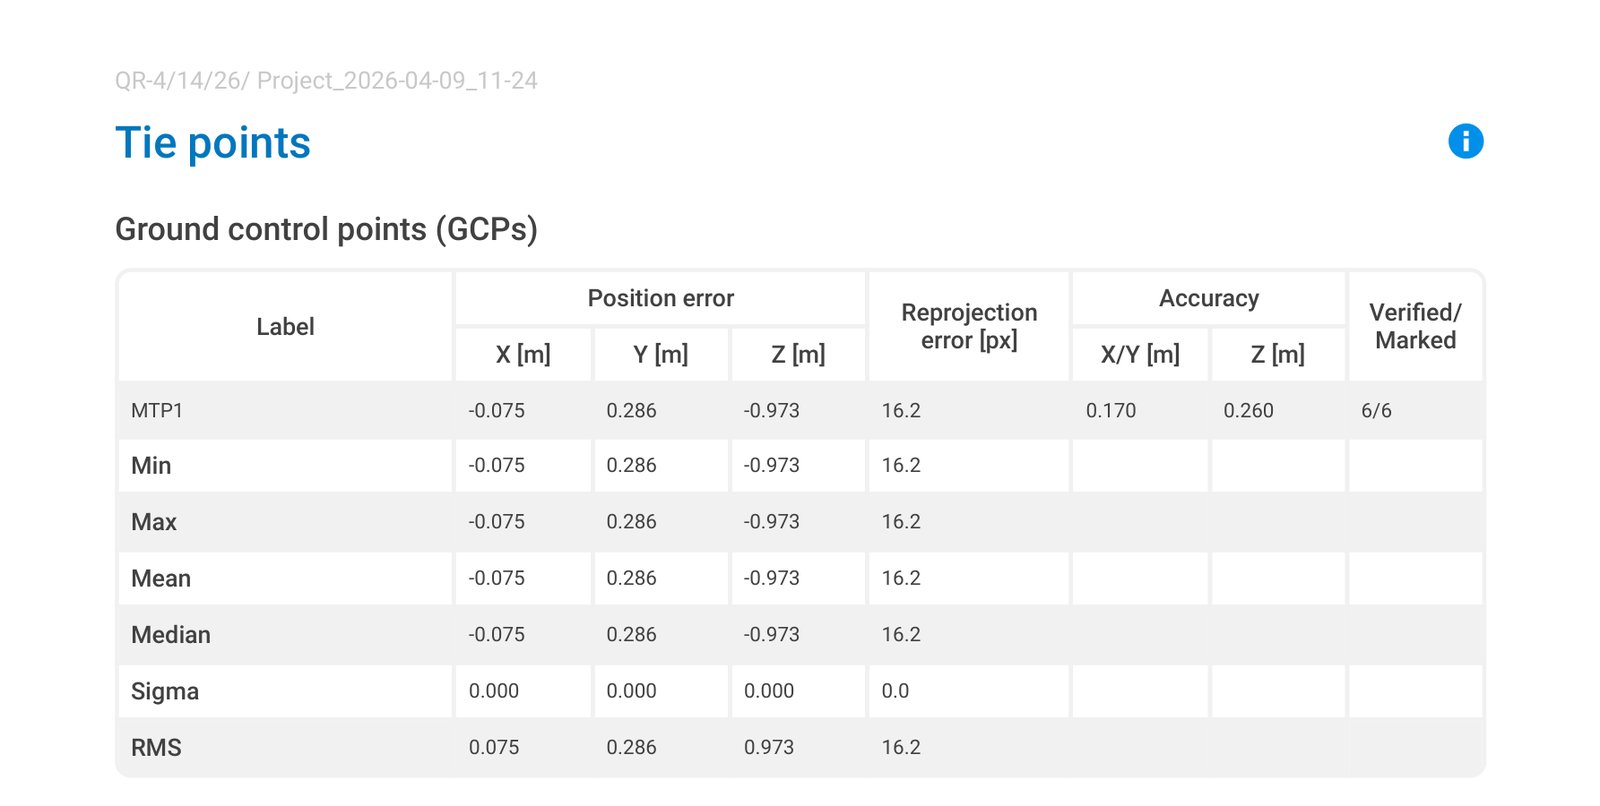
The three error columns — Mean, Sigma, RMS:
- Mean (X, Y, Z): average error per axis. A non-zero mean is systematic bias.
- Sigma (X, Y, Z): standard deviation of errors. Measures scatter.
- RMS: √(mean² + sigma²). The headline number.
Axis asymmetry is diagnostic:
- Large Z error with small XY: insufficient vertical constraint — weak GCP distribution, no oblique passes, doming forming.
- Consistent positive mean in Z: systematic vertical shift — check antenna height offset and ellipsoid-to-geoid conversion (see Diagnosing Vertical Bias in Drone Maps).
- Z errors of 1.5–3× XY errors are normal and expected.
Reading the Metashape Quality Report
Alignment Quality and Reprojection Error
The headline accuracy number: RMS Reprojection Error in pixels.
| Threshold | Meaning |
|---|---|
| <0.5 px | Excellent |
| 0.5–1.0 px | Acceptable |
| >1.0 px | Problem — investigate before continuing |
| >2.0 px | Hard failure; results unreliable |
Reprojection error is a purely internal consistency check. A 0.4 px reprojection error on a project with no GCPs means the cameras are in a coherent cloud. It says nothing about where that cloud sits on Earth.
The USGS Cleaning Workflow: Order Matters

When reprojection error is high, use this sequence — the order is not optional:
- Gradual Selection > Reconstruction Uncertainty — remove geometrically weak points first. Target: max value 10–15 (USGS guidance; 10 is stricter). Delete no more than 50% of total points.
- Gradual Selection > Projection Accuracy — remove points with imprecise image detections. Target: max value 2–5 per USGS; 2–3 for tighter cleanup.
- Gradual Selection > Reprojection Error — remove high-error points after the structure has been cleaned. Target: max threshold 0.3 px per USGS (RMS typically lands at 0.13–0.18 px after the workflow).
Run Tools > Optimize Cameras after each step.
Running reprojection error first is the common mistake. It removes any point with a large residual — including geometrically sound points that have high residuals only because weak points around them are pulling the solution.
What each filter actually measures:
- Reconstruction Uncertainty: how reliably each 3D point’s position was triangulated. Values over 10 indicate unreliable depth.
- Projection Accuracy: how precisely each point’s image detections were localized. Blurry features produce low projection accuracy.
- Reprojection Error: the 2D residual after bundle adjustment. Final consistency check.
Camera Calibration Parameters in Metashape
Normal ranges:
| Parameter | Normal Range | Concern |
|---|---|---|
| f (focal length in pixels) | Near expected converted value | Large deviation = scale error |
| cx, cy (principal point offset) | A few dozen pixels | Hundreds of pixels = wrong sensor dimensions |
| k1 (primary radial distortion) | −0.5 to +0.5 (typical for consumer drone lenses; Agisoft does not publish a hard limit) | Outside range = unusual lens or bad estimate |
The correlation column is where doming risk lives. High correlation between f and k1 in the parameter correlation matrix — typically >0.9 in problematic projects — means the software could not fully separate focal length error from radial distortion error. The model fits itself perfectly and domes in the real world.
Ground Control Table in Metashape
In Metashape’s Reference pane, checked points are control points used in optimization. Unchecked points are check points used only for validation. Verify this setting is correct before running the report.
Red flags in the GCP table:
- One GCP with 10× the error of all others: that point is warping the solution. Remove it, reprocess, and compare.
- All Z errors with the same sign: systematic vertical bias. Check geoid model application and antenna height offset.
- A point marked in fewer than 3 images: the position estimate is unreliable. Mark it in at least 5 clear, in-focus images.
- GCP errors tight, checkpoint errors large: the model is internally biased toward the GCP locations and diverges elsewhere.
Red Flags Operators Miss
1. All-green internal checks with no checkpoints. Green across the board means processing ran cleanly. Before every delivery, ask one question: what is my checkpoint RMS?
2. Camera optimization at 3–4% (yellow) on flat terrain. Even a 3% camera optimization difference on flat, featureless terrain often signals a doming artifact forming. Run a DSM profile across a known-flat area.
3. GCPs at the corners and center, nothing at elevation transitions. Significant terrain variation with no GCPs at different elevations leaves the model accurate at the GCP locations and systematically wrong in Z between them.
4. One outlier GCP that gets mentally averaged away. Four points at 1–2 cm and one at 9 cm — that outlier is actively pulling the solution. Don’t average it. Remove it, reprocess, investigate.
5. Match map showing white areas over deliverable zones. White areas inside the flight mean isolated images with almost no matches. If it overlaps where the client needs measurements, flag it explicitly.
6. Z RMS much larger than XY RMS on flat terrain. Z error of 2–3× XY error is normal. Z error of 5×+ XY error with a consistent sign is a systematic vertical problem — start with whether the geoid model was applied correctly.
When to Reprocess vs. When to Accept
Reprocess if:
- Calibrated images <95%, especially if uncalibrated areas cover deliverable zones.
- Camera optimization relative difference >5%.
- Checkpoint RMSE >3× GSD.
- One GCP has dramatically higher error than all others.
- Overlap map shows interior red zones in the deliverable area.
- Z errors all biased in one direction.
Accept with documentation if:
- Calibrated images >95%, camera optimization <5%.
- Checkpoint RMSE is within spec for the contracted accuracy requirement.
- Red-flagged areas are peripheral to the client’s use.
Re-fly; reprocessing won’t fix it:
- Large water, glass, snow, or blank pavement areas with no adjacent texture.
- More than 10% of images uncalibrated due to motion blur or exposure failures.
- DSM doming on flat terrain persists after cross-hatch and oblique processing.
Quick Reference: Thresholds at a Glance
Pix4D
| Metric | Green | Yellow / Marginal | Red / Hard Fail |
|---|---|---|---|
| Calibrated images | >95% | 75–95% | <75% |
| Camera optimization | <5% diff | 5–20% diff | >20% diff (hard fail) |
| Keypoints per image | >10,000 | 500–10,000 | <500 |
| Matches per image | >1,000 | 100–1,000 | <100 (25 = absolute minimum to calibrate any image) |
| GCP RMS | ≤1.5× GSD | 1.5–2.5× GSD | >2.5× GSD (per PIX4Dmatic) |
| Checkpoint RMS | <1× GSD | 1–3× GSD | >3× GSD |
Metashape
| Metric | Target | Concern | Hard Fail |
|---|---|---|---|
| RMS Reprojection Error | <0.5 px | 0.5–1.0 px | >1.0 px / >2.0 px hard fail |
| Reconstruction Uncertainty (practitioner heuristic; USGS only specifies the ≤10–15 cleanup threshold) | ≤10 | 10–30 | >50 |
| Projection Accuracy (practitioner heuristic) | ≤2–3 | 3–10 | >20 |
| Checkpoint XY Error | <1× GSD | 1–2× GSD | >3× GSD |
| Checkpoint Z Error | <2× GSD | 2–3× GSD | >4× GSD |
Frequently Asked Questions
Can I deliver a project where all the Pix4D quality checks are green but I have no checkpoints?
Not if the project requires defensible accuracy. Green checks confirm the processing ran well and that internal consistency is good. They don’t validate real-world position. A project without checkpoints can’t be called accurate — only processed. If the client’s use doesn’t require validated accuracy, document that explicitly. If it does, you need independent checkpoints.
My Metashape reprojection error is 1.4 px after optimization. What do I do?
Run the USGS iterative cleaning workflow in order: reconstruction uncertainty first, then projection accuracy, then reprojection error, with camera optimization after each step. If you’re still above 1.0 px after cleaning, the underlying dataset has a problem — blurry images, rolling shutter artifacts, or moving objects. Check image quality, remove problematic images individually, and re-optimize.
Pix4D shows camera optimization at 7% for K1. Is the whole project bad?
7% falls in Pix4D’s yellow band (5–20%), not red. The K1 shift means the software re-estimated your radial distortion. The key question is whether that produced doming. Run a terrain profile across any flat area in the DSM. If the terrain is genuinely flat and the DSM shows a dome or bowl, the distortion correction didn’t hold. If the DSM looks correct on flat areas, the re-estimation may have actually improved the result.
What’s the difference between GCP error and checkpoint error in plain terms?
GCP error measures how well the model fits the points the software already knew about and tuned itself to match. Checkpoint error measures how well the model predicts locations it never saw. You can get a GCP error of 0.5 cm on a project that has 4-inch errors everywhere else — the model was optimized for the GCPs, not for the other 99.9% of the area. Checkpoint error is the only honest number for accuracy claims.
All my Z errors are positive — my model is consistently too high. What’s wrong?
Systematic vertical bias almost always traces to one of three sources: the geoid model wasn’t applied or the wrong model was used (NAD83 ellipsoid heights vs. NAVD88 orthometric heights), the base station elevation was entered incorrectly, or the RTK antenna height offset was wrong. Check each in order.
How many checkpoints do I need?
The American Society for Photogrammetry and Remote Sensing (ASPRS) Edition 2 (2024) sets the formal minimum at 30 independent checkpoints for a statistically valid accuracy assessment, with a ceiling of 120. Most commercial drone projects cannot accommodate 30 well-distributed checkpoints, so the pragmatic small-project floor is 3–5 checkpoints — but the deliverable’s accuracy statement must explicitly disclose that the count falls below the ASPRS 30-point minimum. Three checkpoints validate accuracy; five let you tell localized error from systematic. For the placement methodology, see Ground Control Points in Drone Survey.
For the conceptual breakdown of why checkpoint errors are the only valid accuracy number, see Checkpoints vs. Control Points in Drone Survey. For background on RMSE and what it measures, see Understanding RMSE in Drone Mapping.