
Consider a 200-acre corridor survey through mixed hardwood forest in West Virginia. The deliverable required: a bare-earth DEM for drainage modeling. The vendor flew photogrammetry — good camera, proper overlap, RTK positioning. The result looked beautiful. Textured canopy surface, sharp road edges, clean orthomosaic. One problem: the “ground” elevation under the trees was the top of the canopy. Every contour in the forested sections was wrong by 15 to 25 meters. The drainage model was useless.
That kind of failure costs the client months and a rebid. The vendor isn’t incompetent — they used the wrong sensor for the job.
This article is the decision framework that prevents that mistake. Not a vendor pitch. Not a spec sheet comparison. A practitioner-level breakdown of what actually matters in the field.
How Each Technology Actually Works
Before the decision framework makes sense, you need to understand what each sensor measures — because the fundamental difference drives everything else.
Photogrammetry: Pixels to Points
Photogrammetry reconstructs 3D geometry from overlapping photographs. The drone flies a grid pattern, capturing hundreds of images with 75-85 percent overlap. Software — Agisoft Metashape, Pix4Dmapper, WebODM — identifies matching features across image pairs, triangulates their 3D positions, and builds a dense point cloud from the pixel data.
The result: a color point cloud where every point carries RGB values from the original photos. You get orthomosaics, digital surface models, textured 3D meshes. The visual richness is unmatched.
The constraint: the camera has to see the surface. If vegetation, shadow, water, or uniform texture blocks the view, photogrammetry either fails silently or interpolates — and interpolation in dense canopy means your “ground” surface is actually 20 meters up in the trees.

LiDAR: Laser Pulses to Points
LiDAR fires laser pulses — the DJI Zenmuse L2, for example, fires up to 240,000 pulses per second and records up to 1.2 million points per second through multi-return capture — and measures the time each pulse takes to return. That time-of-flight measurement converts directly to distance. No image matching. No feature detection. Direct measurement.
The critical capability: multiple returns. A single laser pulse hits the canopy, and part of the energy reflects back — that is your first return, the canopy surface. The remaining energy continues through gaps in the foliage, hitting branches, understory, and eventually the ground. Modern sensors record 3 to 5 discrete returns per pulse. The last return is your ground point.
Separate the returns, classify ground versus vegetation, and you have a bare-earth DEM under full canopy. Photogrammetry cannot do this. Period.
(If the distinction between a canopy-surface model and a bare-earth terrain model sounds fuzzy, the DSM vs DTM vs DEM explainer is the foundational read. It’s the single most-asked question in drone mapping.)
The tradeoff: LiDAR points carry intensity values, not color. You get geometry without visual context. No orthomosaic. No textured mesh — unless you pair the LiDAR with a simultaneous RGB camera, which most modern systems do.
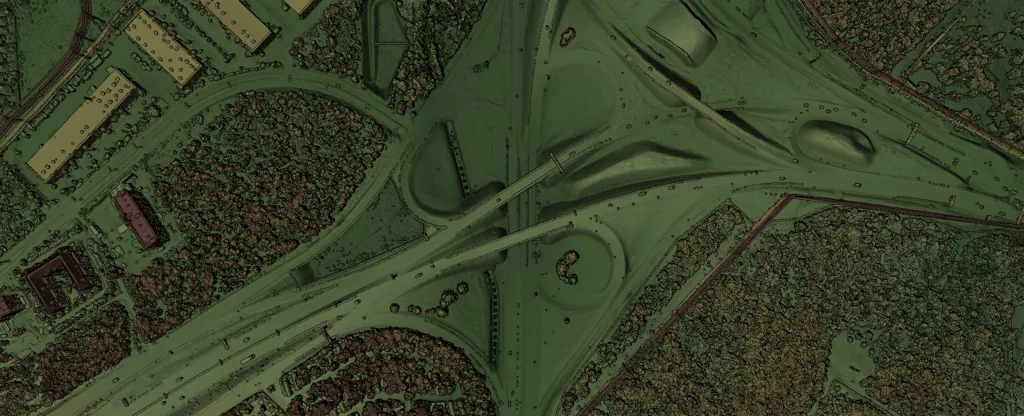 Rebecca equator, via Wikimedia Commons, CC BY-SA 4.0

The Numbers That Matter
Here is where most comparison articles fall apart — they either cherry-pick specs or avoid real numbers entirely. These are field-verified ranges, not marketing claims.
Accuracy
| Metric | Photogrammetry (with GCPs/RTK) | Drone LiDAR |
|---|---|---|
| Horizontal accuracy | 1–3 cm | 3–5 cm |
| Vertical accuracy (open terrain) | 3–5 cm | 3–5 cm |
| Vertical accuracy (vegetated terrain) | Unreliable — surface only | 5–10 cm to bare earth |
| Relative precision | Sub-centimeter | 2–3 cm |
Photogrammetry actually edges LiDAR on horizontal accuracy in open areas — structure-from-motion at high overlap resolves sub-centimeter detail. But that advantage disappears the moment vegetation enters the picture.
A 2024 study in the Canadian Journal of Remote Sensing tested UAV-LiDAR accuracy across six vegetation types — coniferous trees, deciduous trees, short grass, tall grass, short shrubs, and tall shrubs. Vertical accuracy degraded from 3 cm in open areas to 8-10 cm in dense tall vegetation for LiDAR. For photogrammetry in those same conditions, vertical accuracy was meaningless — the algorithm could not resolve the ground surface at all.
Point Density
| System | Typical Density | Notes |
|---|---|---|
| Photogrammetry (80% overlap, 80m AGL) | 150–400 pts/m² | Dense, but surface-only |
| Drone LiDAR (100m AGL) | 50–200 pts/m² | Multi-return; ground + canopy |
| Drone LiDAR (50m AGL, high overlap) | 200–500 pts/m² | Corridor-mapping density |
Photogrammetry often produces denser point clouds than LiDAR in raw numbers. But density is misleading without context. Four hundred points per square meter on the canopy surface tells you nothing about the ground 20 meters below. Fifty LiDAR points per square meter with last-return ground classification tells you everything.
Hardware Costs (2026 Pricing)
| Setup | Approximate Cost | What You Get |
|---|---|---|
| DJI Mavic 3 Enterprise (RGB) | $4,500–$5,500 | Budget photogrammetry, RTK capable |
| DJI Matrice 350 RTK + Zenmuse P1 | $16,000–$20,000 | Professional photogrammetry, 45MP full-frame |
| DJI Matrice 350 RTK + Zenmuse L2 | $25,000–$30,000 | LiDAR + RGB simultaneous capture |
| DJI Matrice 400 + Zenmuse L3 | $35,000–$45,000 | Next-gen LiDAR, 950m range, dual 100MP cameras |
| Specialty LiDAR (ROCK, YellowScan) | $40,000–$120,000 | Higher accuracy, longer range, survey-grade IMU |
Five years ago, the LiDAR premium was 10x. A drone LiDAR rig cost $150,000 to $300,000. The DJI Zenmuse L2 changed the calculus. At $13,000 for the payload alone, LiDAR is no longer an enterprise-only technology. Still more expensive than a camera — but the gap is narrowing fast.

Processing: Two Different Worlds
The hardware cost is obvious. The processing cost — in time, software, and expertise — is where people underestimate the LiDAR investment.
Photogrammetry Processing
Upload images. Align. Build dense cloud. Generate orthomosaic and DSM. The workflow is mature, well-documented, and semi-automated. Metashape Professional runs $3,499 perpetual. Pix4Dmapper is $349/month or $4,990/year. WebODM is free and open-source. Processing time for a 200-acre site at 80 percent overlap: 4 to 12 hours depending on hardware and resolution.
Most operators learn the workflow in a week. The software handles the heavy lifting.
LiDAR Processing
Import raw point cloud. Apply trajectory correction. Classify ground points. Filter noise. Strip-align overlapping flight lines. Generate DEM, DSM, and canopy height model. The workflow requires understanding point cloud classification — what is ground, what is vegetation, what is a building, what is noise.
DJI Terra handles basic classification for Zenmuse L-series data. Beyond that, you are into LAStools ($2,000–$5,000 depending on license), Terrasolid ($8,000+), or open-source tools like CloudCompare (free but manual). Processing time for the same 200-acre site: 2 to 6 hours for the point cloud, plus 1 to 4 hours for manual classification review and cleanup.
The learning curve is steeper. Misclassify ground points and your DEM has phantom hills and artificial valleys. That is a skill developed over months, not days.
To put it plainly: photogrammetry processing is a pipeline you run. LiDAR processing is a craft you practice.
When Photogrammetry Wins
Photogrammetry is not the budget compromise. It is the superior choice for a large set of real-world applications.
Visual deliverables are the primary output. Orthomosaics, textured 3D models, visual site documentation — photogrammetry produces these natively. LiDAR does not. If the client needs a photo-quality map they can read without GIS software, photogrammetry is the answer.
Open, well-textured terrain. Construction sites with exposed dirt, gravel, and concrete. Agricultural fields. Mining stockpiles. Solar farms. Anywhere the camera has a clear line of sight to the surface, photogrammetry matches or beats LiDAR accuracy at a fraction of the hardware cost.
Stockpile volumes on exposed material. Both technologies achieve volumes within 2-3 percent of ground truth on open stockpiles. Photogrammetry costs less per flight and produces the visual documentation most mine operators want alongside the numbers.
Facade and structural inspection. Photogrammetry captures surface detail — cracks, corrosion, paint condition — that LiDAR intensity data cannot resolve. Building inspections, bridge assessments, cell tower audits: photogrammetry.
Budget constraints are real. A $4,500 Mavic 3 Enterprise with RTK produces survey-grade orthomosaics. That is the entire entry cost. A LiDAR-capable platform starts at $25,000. For operators building a business, photogrammetry lets you start generating revenue while the LiDAR fund grows.
When LiDAR Wins
LiDAR is not a luxury upgrade. For certain applications, it is the only technology that works.
Vegetation penetration — the decisive advantage. Forestry inventory, bare-earth DEMs under canopy, flood modeling through riparian corridors. If you need the ground surface and trees are in the way, LiDAR is not optional. Under 70-90 percent canopy cover, photogrammetry returns a surface model of the treetops. LiDAR returns the ground.
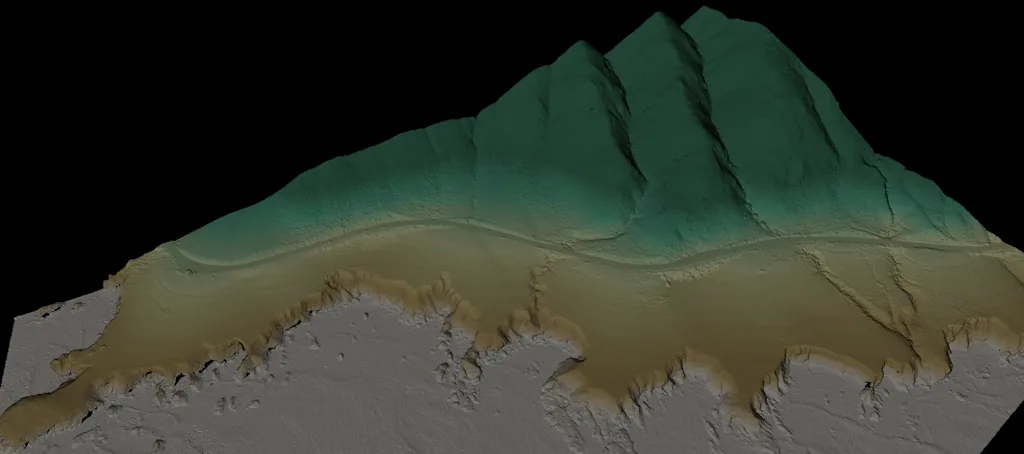 Rebecca equator (Equator software) / USGS 3DEP, via Wikimedia Commons, CC BY-SA 4.0
Corridor mapping. Powerline surveys, pipeline routes, highway design. Long, narrow projects where flight efficiency matters and the terrain varies from open to heavily vegetated. LiDAR maintains consistent vertical accuracy regardless of surface texture or vegetation. A 2025 highway corridor study found LiDAR held 6 cm vertical accuracy across 15 kilometers of mixed terrain — open pavement, standing water, dense roadside vegetation. Photogrammetry accuracy degraded in the textureless and vegetated sections.
Bare-earth DEMs for engineering design. Grading plans, drainage modeling, cut-fill calculations in vegetated areas. The DEM must represent the actual ground surface, not the canopy. LiDAR delivers this directly. Photogrammetry requires manual vegetation removal, which is destructive, expensive, and often impractical.
Low-light and low-texture environments. Overcast skies reduce photogrammetry accuracy by degrading image contrast. Uniform surfaces — dark asphalt, standing water, fresh snow — produce sparse or erroneous photogrammetric point clouds. LiDAR is an active sensor. It generates its own signal and measures return time. Ambient light and surface texture are irrelevant.
Canopy height models for forestry. First return minus last return equals canopy height — per point, across the entire site. Forestry companies use this for stand volume estimation, biomass calculation, and timber inventory without manual field sampling. Photogrammetry produces a canopy surface model but cannot measure the ground beneath it, so canopy height is impossible to derive.

The Decision Framework
The practitioner’s decision framework for choosing between LiDAR and photogrammetry comes down to five questions. Answer them in order.
1. Can the camera see the ground? If vegetation, canopy, or dense understory blocks the ground surface, the answer is LiDAR. Full stop. No amount of photogrammetry processing fixes invisible ground.
2. What deliverables does the client need? If the primary output is an orthomosaic, textured 3D model, or visual documentation — photogrammetry. If the primary output is a bare-earth DEM, classified point cloud, or canopy height model — LiDAR. If both — fly a sensor that captures both simultaneously, like the Zenmuse L2.
3. What is the surface texture? Uniform pavement, standing water, fresh snow, dark materials — photogrammetry struggles with feature matching. LiDAR measures directly and does not care about texture. If you are mapping an asphalt parking lot or a water treatment facility, LiDAR avoids the interpolation artifacts.
4. What is the project scale and geometry? Long corridors favor LiDAR — consistent accuracy over varying terrain with no ground control dependency if using PPK. Small sites with good GCP access favor photogrammetry — higher spatial resolution, lower cost, faster turnaround.
5. What is your budget reality? A $5,000 photogrammetry drone producing $2,000 deliverables pays for itself in three projects. A $30,000 LiDAR rig producing $5,000 deliverables needs six projects to break even on hardware alone — not counting processing software, training time, and the steeper learning curve. Run the numbers for your specific market before buying.
The Hybrid Reality
The industry is converging. The DJI Zenmuse L2 captures LiDAR and 20MP RGB simultaneously. The Zenmuse L3 pairs LiDAR with dual 100MP cameras. Process both datasets from a single flight — LiDAR for ground classification and bare-earth extraction, photogrammetry for orthomosaics and visual deliverables.
This is where the technology is heading. Not LiDAR versus photogrammetry — LiDAR and photogrammetry from the same platform, processed in complementary workflows, delivering complete site models that neither technology produces alone.
Fuse datasets in CloudCompare or Metashape Professional. Use LiDAR ground points to constrain photogrammetric DEM generation. Use photogrammetric RGB values to colorize LiDAR point clouds. The combined product is better than either input.
If you are buying your first mapping platform today and your work includes any vegetation, the Zenmuse L2 on a Matrice 350 is the most versatile option in its price class. You get both technologies in one flight. Learn photogrammetry processing first — it is more forgiving — then build LiDAR classification skills over time.
Bottom Line
Photogrammetry wins on cost, visual deliverables, and horizontal precision in open terrain. LiDAR wins on vegetation penetration, bare-earth accuracy, and consistency across textureless surfaces. Neither is universally better. Both require ground truth validation — GCPs or independent checkpoints — to produce defensible accuracy claims.
The wrong sensor choice does not just reduce accuracy. It produces confident, professional-looking deliverables that are fundamentally wrong — like that West Virginia corridor project with a beautiful canopy surface model labeled as bare earth. The deliverable looked correct. The drainage model it produced was fiction.
Choose based on what the ground looks like, what the client needs, and what the surface allows the sensor to measure. Everything else is a vendor pitch.
For more on positioning methods that apply to both technologies, see RTK vs PPK Drone Mapping. For ground control fundamentals, see Ground Control Points for Drone Surveys. For processing software details, see Pix4D vs Metashape vs WebODM vs RealityCapture.